
Update: I added confidence intervals on all estimates.
Esperanto
In August 2009 a danish popular science book made a big impression on me. It was “Det Virkelige Menneske” (The Real Human) by Dennis Nørmark and Lars Andreassen, and it explained many sides of human culture using evolutionary theory. About language they write (my translation):
The fact that languages are the best indicators of who is in and who is out, might explain why most languages contain very complicated, and often completely unnecessary rules. […] If you mess up the grammar, it is immediately revealed that you do not belong to the group, and the more complicated language, the easier it is to discover misfits.
The quotation addresses one of the secondary purposes of languages, namely to maintain identity by exposing foreigners. Esperanto is a language without that purpose. With easy pronunciation, logical grammar, and a modular word building mechanism, it is a lot easier than conventional languages. Esperanto was constructed in 1887 by LL Zamenhof to unite and bring peace to the world. Peace is not the best description of the following 100 years, but Esperanto is still a very good language. A visionary dream of me and most Esperanto speakers is to make Esperanto a global second language, which would make the world more optimal and more equal. Therefore, Esperanto is also a missionary language which size and demographics are of particular interest.
Esperanto demographics
Thanks to the available data from UEA, esperantujo.directory, edukado, Pasporta Servo, and Lernu! (and Wikipedia), I have made a dataset containing membership numbers in most countries of the world.
| Population | UEA | Lernu! | esp.dir | pasporto | edukado | nat. org | |
|---|---|---|---|---|---|---|---|
| Afghanistan | 27.70 | 1 | 48 | 0 | 0 | 0 | 0 |
| Albania | 2.80 | 14 | 64 | 0 | 1 | 5 | 33 |
| Algeria | 39.20 | 6 | 503 | 1 | 1 | 8 | 0 |
| Andorra | 0.08 | 0 | 167 | 0 | 8 | 0 | |
| Angola | 21.50 | 2 | 42 | 1 | 0 | 0 | |
| Argentina | 41.50 | 29 | 1965 | 27 | 16 | 61 | 140 |
| Armenia | 3.00 | 12 | 92 | 0 | 0 | 1 | 27 |
| Australia | 23.10 | 40 | 2568 | 23 | 16 | 52 | 130 |
| Austria | 8.60 | 44 | 780 | 4 | 8 | 23 | 79 |
| … | … | … | … | … | … | … | … |
| Zimbabwe | 14.20 | 1 | 30 | 0 | 1 | 1 | 0 |
For explanation of the columns see the method section. I fitted a model to this data and used it to estimate the relative frequency of Esperanto speakers in each country. Using population census data from Lithuania, Estonia, Russia, New Zealand (but not Hungary), I have scaled all relative frequencies to get the total number of Esperanto Speakers in each country. The total number of Esperanto speakers is estimated to 62983.9 with confidence interval [59077,68176]/[31460,183420](See Confidence intervals for explanation).

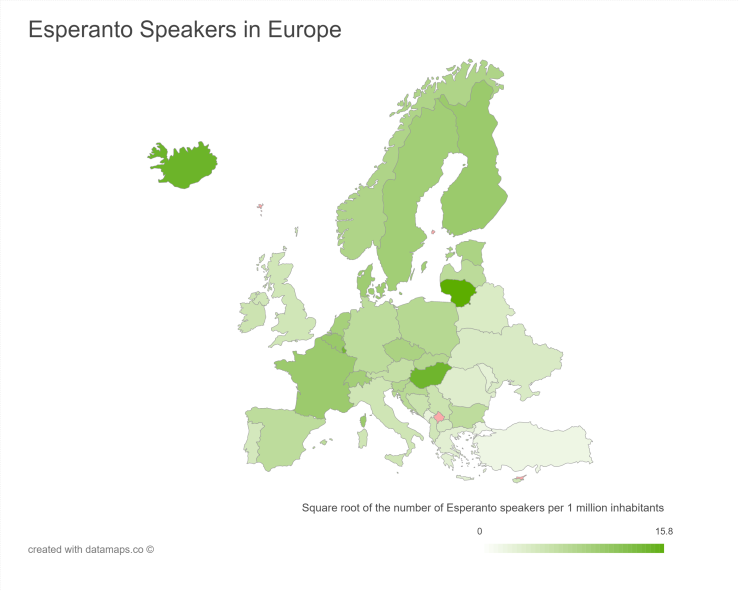
The numbers behind the maps are in a table in the end of the post. Even though the maps do not show, Andorra has the highest density of Esperanto speakers. The countries with the highest number of Esperanto speakers are (in order) Brazil, France, USA, Germany, Russia, Poland and Spain.
The model itself assumes that numbers of members are proportional to Esperanto speakers. This is not always true because the organizations are not equally popular in all countries. The model tries to make up for it by allowing some deviation in a few categories without changing the relative estimated frequency. However, if all categories are underrepresented in a country, the relative estimated frequency will be too low. Hungary is such a country because the model estimates the number of Esperanto speakers to be 1997.5 while a recent population census found that number to be 8397. One explanation could be that Esperanto is being taught in hungarian schools which produces esperanto speakers who are less reliant on international organisations.
The definition of an Esperanto speaker is someone who would answer Esperanto when asked about spoken languages by the authorities.
Methods
Model
I will give an intuitive explanation of the model using Lithuania as an example. It has the observations
| pop | UEA | Lernu! | esp.dir | paspo. | edukado | nat. org. | |
|---|---|---|---|---|---|---|---|
| Lithuania | 3 million | 43 | 5127 | 8 | 13 | 32 | 960 |
According to the UEA column, 43 members of the 5501 UEA members are Lithuanian. That indicates that 0.78% of all Esperanto speakers come from Lithuania. However, according to the Lernu! column, 2.88% of all Esperanto speakers come from Lithuania. We would like a single number that takes all columns into account. One could take an average, 

- The number of members of organization
in country
is
where
is the number of inhabitants in country
is the relative frequency of Esperanto speakers in country in
is the total number of members of organization
is the number to make the equation be true. Hopefully it is close to 1.
- For each country
- ‘far away’ is defined such that it both satisfies some nice mathematical properties and reduces the distance between the
- ‘far away’ is defined such that it both satisfies some nice mathematical properties and reduces the distance between the
- Let
be the actual number of Esperanto speakers in country
- Calculate
for the four mentioned countries.
- Caluclate the average
- The number of Esperanto Speakers in country
- Calculate


Strict mathematical explanation of the model
Let 


with independence within the 

but in practice I make the constraint 
The confidence intervals were calculated using Bayesian bootstrap. In the first type of confidence interval, we assume that 
Confidence intervals
We would not be surprised if the true number of esperanto speakers in the world was not precisely 62983.9. We rather believe that the true number could be somewhere in an area around 62983.9. A confidence interval specifies such an area using statistics. One can believe any value in the confidence interval without disagreeing with the assumptions of the model.
I calculated two types of confidence intervals. The first assumes that the scaling factor is known. The scaling factor is the number of census esperanto speakers per ‘internet’ esperanto user (see 
Data
Data is collected from the following websites
- UEA is an international Esperanto interest group whose goal is to spread Esperanto and promote language equality. They have put their member numbers on their website, but some clicking is necessary to retrieve the numbers.
- lernu.net is the largest international learning portal for Esperanto. Many profiles are inactive and belong to people who were only briefly interested in Esperanto. Therefore, the number of users from a country could be higher than the actual number of Esperanto speakers in that country.
- Esperantujo.directory is an online ‘adress book’ of Esperanto speakers. I am not in it (yet).
- Pasporta Servo is a service for hosting Esperanto speakers for free. The numbers in the pasporta servo column are the numbers of registered hosts in each country.
- Edukado is another learning portal, which is more serious than lernu.
- National organization sizes are the sizes of the national esperanto organizations associated with the UEA.
There are missing data in the dataset. E.g. Andorra has a missing value on esperantujo.directory because the country is too small to appear on their map. Angola does not have a value on national organization because they do have a national esperanto organization but its size is not disclosed on the UEA website. The missing values do not cause inference problems in the model.
Resources
The data and my R-scripts are available on github. I have used datamaps.co to make the maps.
Results
Below are all the countries listed according to their frequency of Esperanto speakers. Frequency is the number of Esperanto speakers per 1 million inhabitants. Total is the total number of Esperanto speakers. Proportion is how big a share each country has of the total number of Esperanto speakers.
| Rank | Frequency | Total | Proportion | |
|---|---|---|---|---|
| Andorra | 1 [1,2] | 620.03 [277.3,1039.9]/ [180.4,2246.5] | 48.4 [22,81]/ [14,175] | 0.0008 [0.0003,0.0013] |
| Lithuania | 2 [1,6] | 249.32 [156.7,482.6]/ [119.2,936.9] | 748 [470,1448]/ [357,2811] | 0.0119 [0.0072,0.0225] |
| Iceland | 3 [2,8] | 210.07 [109.7,375]/ [71.5,729.9] | 67.9 [35,121]/ [23,236] | 0.0011 [0.0006,0.0019] |
| Hungary | 4 [2,6] | 203.82 [151.1,283.8]/ [98.3,695.9] | 1997.5 [1481,2781]/ [963,6820] | 0.0317 [0.0242,0.0449] |
| Luxembourg | 5 [2,10] | 196.82 [93.9,285.1]/ [60.4,681.1] | 112.2 [53,163]/ [34,388] | 0.0018 [0.0008,0.0026] |
| New Caledonia | 6 [3,16] | 122.85 [64.1,234.2]/ [47.2,450.3] | 32.9 [17,63]/ [13,121] | 0.0005 [0.0003,0.001] |
| Belgium | 7 [6,12] | 109.48 [77.4,135.8]/ [38.1,320.4] | 1237.1 [875,1535]/ [430,3621] | 0.0196 [0.0132,0.0239] |
| Finland | 8 [5,15] | 105.89 [69.9,155.2]/ [48.7,331.7] | 582.4 [384,854]/ [268,1824] | 0.0092 [0.006,0.0137] |
| France | 9 [5,17] | 104.01 [61.4,132.8]/ [44.2,327.8] | 6906.6 [4078,8816]/ [2933,21763] | 0.1097 [0.067,0.1381] |
| Denmark | 10 [5,16] | 97.34 [65.7,145]/ [44.6,321.7] | 554.8 [375,827]/ [254,1834] | 0.0088 [0.0061,0.013] |
| Sweden | 11 [8,16] | 91.99 [67.8,117.3]/ [40.2,265.1] | 910.7 [671,1162]/ [398,2625] | 0.0145 [0.0109,0.0183] |
| Switzerland | 12 [8,20] | 89.44 [55.6,115.4]/ [36.2,270.9] | 724.4 [451,935]/ [293,2195] | 0.0115 [0.0071,0.0152] |
| Netherlands | 13 [7,19] | 84.87 [60.9,115.1]/ [37.2,267.3] | 1442.8 [1036,1956]/ [632,4544] | 0.0229 [0.0159,0.0304] |
| Czech Republic | 14 [10,19] | 76.23 [59,90.3]/ [34.9,245.3] | 800.4 [619,948]/ [366,2575] | 0.0127 [0.0095,0.0154] |
| Estonia | 15 [7,26] | 74.02 [41.9,117.6]/ [34.3,165.2] | 96.2 [55,153]/ [45,215] | 0.0015 [0.0009,0.0024] |
| Norway | 16 [10,23] | 68.99 [50,96.3]/ [30.9,226.5] | 358.7 [260,501]/ [160,1178] | 0.0057 [0.0041,0.0079] |
| Slovenia | 17 [10,32] | 60.79 [33.2,95.7]/ [22.3,230.3] | 127.7 [70,201]/ [47,484] | 0.002 [0.0011,0.0032] |
| Liechtenstein | 18 [14,62] | 59.67 [11.1,74.2]/ [8.3,199] | 2.2 [0,3]/ [0,7] | 0 [0,0] |
| Slovakia | 19 [10,28] | 59.4 [39.2,81.3]/ [23.7,182.7] | 320.8 [212,439]/ [128,986] | 0.0051 [0.0034,0.007] |
| Poland | 20 [16,24] | 57.55 [48.9,65.5]/ [28.6,154.9] | 2215.9 [1882,2524]/ [1100,5965] | 0.0352 [0.0294,0.0404] |
| Croatia | 21 [14,28] | 55.09 [39,71.3]/ [24.4,175.7] | 231.4 [164,300]/ [102,738] | 0.0037 [0.0026,0.0048] |
| Israel | 22 [15,34] | 50.56 [31.2,70.6]/ [20.8,174.8] | 409.5 [253,572]/ [169,1416] | 0.0065 [0.004,0.0091] |
| Latvia | 23 [13,35] | 49.01 [30.8,80.3]/ [21.1,159.9] | 98 [62,161]/ [42,320] | 0.0016 [0.0009,0.0025] |
| Germany | 24 [19,30] | 47.51 [36.1,58.5]/ [18.6,138.1] | 3871.8 [2942,4769]/ [1519,11256] | 0.0615 [0.0475,0.0754] |
| Spain | 25 [20,28] | 47.38 [39.5,54.3]/ [21.2,133.4] | 2198.5 [1835,2519]/ [985,6192] | 0.0349 [0.0292,0.0399] |
| New Zealand | 26 [18,33] | 46.42 [31.4,58.1]/ [21.8,141.4] | 208.9 [141,261]/ [98,636] | 0.0033 [0.0022,0.0043] |
| Bulgaria | 27 [18,38] | 46.12 [28.1,63.3]/ [19,124] | 332 [202,455]/ [136,893] | 0.0053 [0.0032,0.0072] |
| Austria | 28 [22,36] | 38.77 [29.4,48.5]/ [18.1,121] | 333.4 [252,417]/ [155,1041] | 0.0053 [0.004,0.0066] |
| Brazil | 29 [24,39] | 36.5 [27.5,47.6]/ [16.3,104.5] | 7314 [5509,9545]/ [3276,20939] | 0.1161 [0.0887,0.148] |
| Malta | 30 [16,45] | 35.25 [22.3,66.3]/ [17.5,144.4] | 15 [9,28]/ [7,61] | 0.0002 [0.0002,0.0005] |
| Greenland | 31 [26,93] | 34.24 [3.9,42]/ [4.4,98.8] | 1.9 [0,2]/ [0,6] | 0 [0,0] |
| Mongolia | 32 [19,63] | 34.05 [11.1,61.6]/ [10.1,118.6] | 95.3 [31,172]/ [28,332] | 0.0015 [0.0005,0.0026] |
| Australia | 33 [28,41] | 31.92 [26.2,36.6]/ [15.5,98.7] | 737.4 [605,845]/ [358,2281] | 0.0117 [0.0092,0.0136] |
| Bosnia and Herzegovina | 34 [27,47] | 30.7 [18.7,44]/ [13.9,81.5] | 116.7 [71,167]/ [53,310] | 0.0019 [0.0011,0.0027] |
| Republic of Serbia | 35 [27,49] | 29.7 [18,40.8]/ [11.8,98.6] | 210.9 [128,290]/ [84,700] | 0.0033 [0.002,0.0046] |
| Canada | 36 [30,41] | 29.36 [25,34.7]/ [14.7,88.8] | 1033.4 [880,1220]/ [518,3128] | 0.0164 [0.0141,0.0199] |
| Costa Rica | 37 [28,45] | 28.99 [21.7,40.9]/ [12.4,80] | 142.1 [106,200]/ [61,392] | 0.0023 [0.0017,0.0032] |
| Uruguay | 38 [29,46] | 28.9 [22,37.9]/ [13.3,94] | 98.3 [75,129]/ [45,320] | 0.0016 [0.0012,0.0021] |
| Ireland | 39 [27,48] | 28.88 [19.3,41.8]/ [13.5,91.6] | 132.8 [89,192]/ [62,421] | 0.0021 [0.0014,0.0031] |
| Italy | 40 [33,46] | 26.13 [21.1,31.5]/ [12.2,71.1] | 1562.5 [1259,1882]/ [730,4250] | 0.0248 [0.0198,0.0295] |
| Togo | 41 [27,63] | 25.9 [10.8,39.3]/ [8.9,79] | 183.9 [77,279]/ [63,561] | 0.0029 [0.0012,0.0045] |
| Cyprus | 42 [35,56] | 25.58 [14,30.5]/ [8.8,79.7] | 20.5 [11,24]/ [7,64] | 0.0003 [0.0002,0.0004] |
| United Kingdom | 43 [35,47] | 24.5 [21,30.1]/ [13.5,72.3] | 1595.3 [1367,1961]/ [879,4709] | 0.0253 [0.0214,0.0318] |
| Albania | 44 [23,62] | 24.26 [11.7,47.6]/ [7.5,80.5] | 67.9 [33,133]/ [21,225] | 0.0011 [0.0005,0.0021] |
| Cuba | 45 [34,66] | 22.08 [10.9,31.7]/ [6.8,72.9] | 249.5 [124,358]/ [76,823] | 0.004 [0.002,0.0058] |
| Portugal | 46 [34,54] | 20.64 [15.6,30.5]/ [10,67.3] | 212.6 [161,315]/ [103,693] | 0.0034 [0.0025,0.0047] |
| Nicaragua | 47 [39,61] | 19.16 [12.5,27.6]/ [8.5,57.6] | 116.9 [76,168]/ [52,352] | 0.0019 [0.0012,0.0027] |
| Macedonia | 48 [38,63] | 18.54 [10.9,27.1]/ [8.3,61.5] | 38.9 [23,57]/ [17,129] | 0.0006 [0.0004,0.0009] |
| United States of America | 49 [39,60] | 18.34 [12.8,26.2]/ [7.4,63.6] | 5847.1 [4079,8367]/ [2360,20290] | 0.0928 [0.0674,0.1335] |
| Hong Kong | 50 [28,84] | 17.81 [5.6,39.5]/ [5,92.4] | 131.8 [42,292]/ [37,684] | 0.0021 [0.0007,0.0047] |
| Argentina | 51 [45,62] | 17.58 [12.5,22.4]/ [8,54.5] | 729.6 [520,929]/ [332,2260] | 0.0116 [0.0081,0.0144] |
| The Bahamas | 52 [27,73] | 17.39 [7.7,41.1]/ [6.4,78.1] | 6.6 [3,16]/ [2,30] | 0.0001 [0,0.0003] |
| Ukraine | 53 [46,61] | 16.19 [13.1,22.6]/ [7.8,51.5] | 694.7 [562,970]/ [336,2209] | 0.011 [0.0087,0.015] |
| Armenia | 54 [32,71] | 16.06 [8.1,33.9]/ [5.4,67.8] | 48.2 [24,102]/ [16,203] | 0.0008 [0.0004,0.0016] |
| Russia | 55 [48,63] | 15.96 [11.6,19.8]/ [7.8,50.5] | 2298.1 [1667,2852]/ [1130,7276] | 0.0365 [0.0272,0.0468] |
| Belarus | 56 [48,63] | 15.71 [11.7,18.4]/ [7.8,48.5] | 149.3 [111,175]/ [74,460] | 0.0024 [0.0018,0.0028] |
| Puerto Rico | 57 [41,81] | 15.53 [5.8,26.4]/ [5.2,57.5] | 54.3 [20,92]/ [18,201] | 0.0009 [0.0003,0.0014] |
| Chile | 58 [44,69] | 14.45 [8.5,23.3]/ [6.5,53.8] | 254.4 [150,410]/ [114,948] | 0.004 [0.0024,0.0063] |
| Colombia | 59 [50,70] | 13.09 [9.2,19.4]/ [6.3,48.3] | 616.7 [433,916]/ [298,2275] | 0.0098 [0.0069,0.0147] |
| Benin | 60 [44,90] | 12.5 [4.7,23.6]/ [3.8,46.3] | 132.5 [50,250]/ [40,490] | 0.0021 [0.0008,0.0041] |
| Iran | 61 [47,74] | 12.5 [7.7,20.3]/ [4.9,44.4] | 968.7 [598,1571]/ [383,3437] | 0.0154 [0.0095,0.0246] |
| Belize | 62 [46,90] | 12.24 [4.2,20.4]/ [2.6,38.8] | 4.7 [2,8]/ [1,15] | 0.0001 [0,0.0001] |
| Romania | 63 [53,73] | 11.87 [8.5,16.9]/ [4.7,35.4] | 235.1 [168,335]/ [93,700] | 0.0037 [0.0024,0.0055] |
| South Korea | 64 [55,75] | 11.67 [7.6,16]/ [5,38.1] | 585.8 [383,803]/ [251,1911] | 0.0093 [0.0061,0.0129] |
| Japan | 65 [43,87] | 11.31 [5,25.5]/ [4,42.6] | 1439.9 [637,3243]/ [513,5420] | 0.0229 [0.0102,0.0489] |
| Taiwan | 66 [49,82] | 10.53 [6,18.9]/ [4.2,38.4] | 247.5 [140,444]/ [99,902] | 0.0039 [0.0022,0.0072] |
| Cape Verde | 67 [55,115] | 10.45 [1.6,14.2]/ [2.3,34.4] | 5.5 [1,8]/ [1,18] | 0.0001 [0,0.0001] |
| East Timor | 68 [43,100] | 10.44 [3.1,23.1]/ [2.7,40.9] | 12.5 [4,28]/ [3,49] | 0.0002 [0.0001,0.0004] |
| Venezuela | 69 [57,83] | 9.66 [5.5,14.8]/ [3.4,30.9] | 293.5 [168,449]/ [103,938] | 0.0047 [0.0026,0.0069] |
| Burundi | 70 [56,112] | 9.6 [2.2,14.7]/ [2.4,32.7] | 96.9 [22,148]/ [25,331] | 0.0015 [0.0004,0.0024] |
| Greece | 71 [61,76] | 9.46 [7.2,11.9]/ [4.5,31.1] | 102.2 [77,129]/ [48,336] | 0.0016 [0.0012,0.0021] |
| Mexico | 72 [59,82] | 8.74 [5.7,12.6]/ [3.6,28.1] | 1069 [696,1539]/ [435,3438] | 0.017 [0.0114,0.0249] |
| Peru | 73 [54,90] | 8.44 [4.4,14.8]/ [3.2,29.3] | 256.6 [133,451]/ [98,891] | 0.0041 [0.002,0.0072] |
| El Salvador | 74 [60,91] | 8.2 [4,12.8]/ [2.6,29.7] | 51.6 [25,81]/ [16,187] | 0.0008 [0.0004,0.0013] |
| Georgia | 75 [60,82] | 8.19 [5.5,13.3]/ [3.7,25.6] | 30.3 [20,49]/ [14,95] | 0.0005 [0.0003,0.0008] |
| Panama | 76 [55,111] | 8.07 [1.8,16.2]/ [1.5,39.8] | 31.5 [7,63]/ [6,155] | 0.0005 [0.0001,0.001] |
| Brunei | 77 [67,125] | 7.97 [1.1,10.1]/ [1.2,24.6] | 3.3 [0,4]/ [0,10] | 0.0001 [0,0.0001] |
| Moldova | 78 [66,90] | 7.92 [3.9,10.5]/ [3.2,24.2] | 28.5 [14,38]/ [11,87] | 0.0005 [0.0002,0.0006] |
| Dominican Republic | 79 [57,100] | 7.49 [2.7,14.7]/ [2,23.3] | 77.9 [28,153]/ [21,242] | 0.0012 [0.0005,0.0024] |
| Montenegro | 80 [63,93] | 6.69 [3.6,11.3]/ [2,24.1] | 4.2 [2,7]/ [1,15] | 0.0001 [0,0.0001] |
| Ecuador | 81 [63,92] | 6.66 [3.8,11.4]/ [2.9,26.2] | 104.6 [60,178]/ [46,412] | 0.0017 [0.001,0.0029] |
| Senegal | 82 [65,96] | 6.55 [3.2,11.3]/ [2.5,21.5] | 96.9 [48,167]/ [37,318] | 0.0015 [0.0008,0.0027] |
| Kazakhstan | 83 [77,93] | 5.34 [3.8,6.9]/ [2.7,16.6] | 90.8 [65,118]/ [45,282] | 0.0014 [0.001,0.0018] |
| Guatemala | 84 [72,107] | 5.18 [2.5,8.4]/ [2.6,18.5] | 80.2 [39,131]/ [41,287] | 0.0013 [0.0006,0.0021] |
| Nepal | 85 [72,106] | 5.09 [2.4,8.9]/ [1.4,18.2] | 157.9 [74,277]/ [43,563] | 0.0025 [0.0011,0.0045] |
| Honduras | 86 [77,110] | 5.04 [2.2,7.3]/ [1.9,14.5] | 40.8 [18,59]/ [15,117] | 0.0006 [0.0003,0.0009] |
| Bolivia | 87 [74,107] | 5.03 [2.4,8.1]/ [1.6,18.3] | 55.3 [26,89]/ [18,202] | 0.0009 [0.0004,0.0014] |
| United Arab Emirates | 88 [79,106] | 4.69 [2.5,6.8]/ [2.5,16.2] | 46.4 [25,67]/ [25,161] | 0.0007 [0.0004,0.0011] |
| Swaziland | 89 [56,117] | 4.54 [1.8,13.7]/ [1.3,24.5] | 5.9 [2,18]/ [2,32] | 0.0001 [0,0.0003] |
| Trinidad and Tobago | 90 [79,140] | 4.51 [0.7,6.4]/ [0.7,15.8] | 6.3 [1,9]/ [1,22] | 0.0001 [0,0.0002] |
| Vanuatu | 91 [34,113] | 4.39 [2,35.6]/ [1.5,53.6] | 1.2 [1,10]/ [0,15] | 0 [0,0.0002] |
| Vietnam | 92 [81,105] | 4.34 [2.4,6.1]/ [1.8,12.9] | 389.7 [218,551]/ [162,1158] | 0.0062 [0.0034,0.0087] |
| Maurtitius | 93 [79,141] | 4.27 [0.7,6]/ [0.6,14.8] | 5.5 [1,8]/ [1,19] | 0.0001 [0,0.0001] |
| Morocco | 94 [75,118] | 3.81 [1.5,8.8]/ [0.9,17.3] | 125.7 [51,291]/ [31,569] | 0.002 [0.0008,0.0045] |
| Tunisia | 95 [81,118] | 3.78 [1.5,6]/ [1.5,11.5] | 42.3 [16,67]/ [17,129] | 0.0007 [0.0003,0.0011] |
| Qatar | 96 [85,111] | 3.6 [2,4.9]/ [1.2,13.3] | 9.4 [5,13]/ [3,35] | 0.0001 [0.0001,0.0002] |
| Paraguay | 97 [81,134] | 3.57 [1,6.3]/ [0.8,15.6] | 24.3 [7,43]/ [5,106] | 0.0004 [0.0001,0.0007] |
| Suriname | 98 [89,132] | 3.54 [0.9,4.4]/ [0.5,10.8] | 1.9 [1,2]/ [0,6] | 0 [0,0] |
| Turkey | 99 [86,115] | 3.42 [1.7,5.1]/ [1.1,12.1] | 256.5 [128,385]/ [82,904] | 0.0041 [0.002,0.0062] |
| Maldives | 100 [89,141] | 3.37 [0.7,4]/ [0.7,10] | 1.2 [0,1]/ [0,3] | 0 [0,0] |
| Lebanon | 101 [89,122] | 3.23 [1.3,4.7]/ [0.9,11.1] | 19.4 [8,28]/ [6,67] | 0.0003 [0.0001,0.0005] |
| Tajikistan | 102 [82,130] | 3.18 [1,5.5]/ [0.8,11.7] | 27.4 [9,47]/ [7,100] | 0.0004 [0.0001,0.0007] |
| Malaysia | 103 [82,123] | 2.94 [1.2,5.8]/ [0.8,9.9] | 93.6 [39,184]/ [24,314] | 0.0015 [0.0006,0.0029] |
| Azerbaijan | 104 [94,117] | 2.78 [1.6,3.6]/ [1.1,9.5] | 27.2 [16,35]/ [11,93] | 0.0004 [0.0002,0.0006] |
| South Africa | 105 [86,123] | 2.77 [1.3,5.2]/ [0.9,10.2] | 146.9 [69,273]/ [47,543] | 0.0023 [0.0011,0.0043] |
| Bhutan | 106 [96,144] | 2.7 [0.6,3.3]/ [0.5,9.2] | 2.2 [0,3]/ [0,7] | 0 [0,0] |
| Madagascar | 107 [93,117] | 2.66 [1.6,4.1]/ [1.1,8.1] | 60.8 [37,95]/ [25,186] | 0.001 [0.0006,0.0015] |
| Kyrgyzstan | 108 [95,116] | 2.6 [1.7,3.7]/ [1,8.2] | 15.9 [10,22]/ [6,50] | 0.0003 [0.0002,0.0004] |
| Gabon | 109 [97,147] | 2.55 [0.5,3.5]/ [0.4,9.3] | 4.6 [1,6]/ [1,17] | 0.0001 [0,0.0001] |
| Algeria | 110 [92,115] | 2.52 [1.8,3.9]/ [1.2,9.4] | 98.8 [70,151]/ [46,368] | 0.0016 [0.0011,0.0023] |
| Democratic Republic of the Congo | 111 [94,127] | 2.51 [1.1,3.4]/ [0.8,7.5] | 169.3 [76,232]/ [57,504] | 0.0027 [0.0013,0.0038] |
| Fiji | 112 [98,136] | 2.45 [0.8,3]/ [0.5,8.1] | 2.2 [1,3]/ [0,7] | 0 [0,0] |
| Djibouti | 113 [99,153] | 2.4 [0.4,3]/ [0.4,7.3] | 2.2 [0,3]/ [0,7] | 0 [0,0] |
| Jamaica | 114 [98,155] | 2.27 [0.3,3.4]/ [0.3,7.8] | 6.1 [1,9]/ [1,21] | 0.0001 [0,0.0001] |
| Pakistan | 115 [90,136] | 2.24 [0.8,4]/ [0.6,8.4] | 408.3 [137,734]/ [105,1537] | 0.0065 [0.0022,0.0119] |
| Kuwait | 116 [96,144] | 2.22 [0.6,3.4]/ [0.5,7.3] | 9.3 [3,14]/ [2,31] | 0.0001 [0,0.0002] |
| Namibia | 117 [100,157] | 2.17 [0.3,3.1]/ [0.3,7.6] | 5 [1,7]/ [1,17] | 0.0001 [0,0.0001] |
| Central African Republic | 118 [89,154] | 1.89 [0.4,4.9]/ [0.2,7.9] | 9.5 [2,24]/ [1,39] | 0.0002 [0,0.0004] |
| Republic of the Congo | 119 [88,138] | 1.64 [0.7,4.6]/ [0.5,10.2] | 7.7 [4,21]/ [2,48] | 0.0001 [0.0001,0.0003] |
| Philippines | 120 [102,138] | 1.57 [0.7,2.8]/ [0.6,5.2] | 154.1 [69,271]/ [60,515] | 0.0024 [0.0011,0.0043] |
| Jordan | 121 [108,152] | 1.49 [0.4,2.3]/ [0.4,5.3] | 14.6 [4,22]/ [4,52] | 0.0002 [0.0001,0.0004] |
| Ghana | 122 [105,139] | 1.42 [0.8,2.6]/ [0.5,5.1] | 40.1 [22,73]/ [14,144] | 0.0006 [0.0003,0.0012] |
| Solomon Islands | 123 [116,159] | 1.35 [0.3,1.6]/ [0.3,3.7] | 0.9 [0,1]/ [0,2] | 0 [0,0] |
| Guinea Bissau | 124 [117,158] | 1.28 [0.3,1.6]/ [0.4,3.7] | 1.9 [0,2]/ [1,6] | 0 [0,0] |
| Thailand | 125 [118,135] | 1.22 [0.8,1.6]/ [0.6,3.6] | 81.9 [56,107]/ [38,242] | 0.0013 [0.0009,0.0017] |
| China | 126 [115,135] | 1.2 [0.9,1.7]/ [0.6,3.8] | 1626.6 [1236,2365]/ [778,5185] | 0.0258 [0.02,0.0362] |
| Equatorial Guinea | 127 [119,166] | 1.17 [0.2,1.4]/ [0.2,3.1] | 1.4 [0,2]/ [0,4] | 0 [0,0] |
| Guyana | 128 [119,161] | 1.16 [0.2,1.4]/ [0.3,3.2] | 0.9 [0,1]/ [0,2] | 0 [0,0] |
| Mauritania | 129 [118,169] | 1.07 [0.1,1.4]/ [0.2,3.7] | 4 [0,5]/ [1,14] | 0.0001 [0,0.0001] |
| Haiti | 130 [115,163] | 1.03 [0.2,1.8]/ [0.2,3.6] | 11.5 [2,20]/ [3,39] | 0.0002 [0,0.0003] |
| Rwanda | 131 [105,152] | 1.02 [0.4,2.8]/ [0.4,4] | 11.9 [5,33]/ [4,46] | 0.0002 [0.0001,0.0005] |
| Gambia | 132 [124,158] | 1.01 [0.3,1.3]/ [0.2,2.9] | 1.9 [1,2]/ [0,6] | 0 [0,0] |
| Syria | 133 [118,153] | 1 [0.4,1.5]/ [0.4,3.1] | 18.7 [7,27]/ [8,57] | 0.0003 [0.0001,0.0004] |
| Botswana | 134 [124,161] | 0.98 [0.2,1.2]/ [0.2,2.9] | 2.2 [0,3]/ [0,6] | 0 [0,0] |
| Ivory Coast | 135 [112,150] | 0.98 [0.4,2]/ [0.3,4.2] | 22.2 [10,47]/ [8,95] | 0.0004 [0.0002,0.0008] |
| Cambodia | 136 [121,145] | 0.91 [0.6,1.4]/ [0.4,3.1] | 14.3 [10,22]/ [6,49] | 0.0002 [0.0002,0.0004] |
| Zimbabwe | 137 [120,147] | 0.85 [0.6,1.3]/ [0.4,2.8] | 12.1 [8,19]/ [6,40] | 0.0002 [0.0001,0.0003] |
| Indonesia | 138 [123,150] | 0.84 [0.5,1.2]/ [0.3,2.9] | 209.9 [119,304]/ [77,718] | 0.0033 [0.0018,0.005] |
| Saudi Arabia | 139 [118,170] | 0.84 [0.1,1.6]/ [0.1,3.5] | 24.1 [3,46]/ [2,102] | 0.0004 [0.0001,0.0007] |
| Niger | 140 [119,151] | 0.81 [0.5,1.5]/ [0.3,3.3] | 16.7 [9,31]/ [7,69] | 0.0003 [0.0001,0.0005] |
| Cameroon | 141 [119,151] | 0.79 [0.4,1.4]/ [0.3,3] | 17.9 [9,32]/ [8,69] | 0.0003 [0.0001,0.0005] |
| Libya | 142 [127,168] | 0.78 [0.1,1]/ [0.2,2.4] | 5 [1,7]/ [1,15] | 0.0001 [0,0.0001] |
| United Republic of Tanzania | 143 [120,165] | 0.7 [0.2,1.4]/ [0.2,2.4] | 38.8 [11,79]/ [11,133] | 0.0006 [0.0002,0.0013] |
| Angola | 144 [130,162] | 0.69 [0.2,1.1]/ [0.2,2] | 14.9 [5,23]/ [4,43] | 0.0002 [0.0001,0.0004] |
| Uzbekistan | 145 [135,150] | 0.68 [0.5,0.9]/ [0.3,2.2] | 21.6 [16,28]/ [9,68] | 0.0003 [0.0003,0.0004] |
| Malawi | 146 [116,166] | 0.67 [0.2,1.6]/ [0.2,3] | 11.3 [3,27]/ [4,51] | 0.0002 [0,0.0004] |
| Laos | 147 [134,164] | 0.64 [0.2,0.9]/ [0.1,2.1] | 4.2 [1,6]/ [1,14] | 0.0001 [0,0.0001] |
| Egypt | 148 [125,164] | 0.64 [0.2,1.3]/ [0.2,2.8] | 52.5 [14,104]/ [15,229] | 0.0008 [0.0002,0.0017] |
| Sri Lanka | 149 [126,159] | 0.58 [0.3,1.2]/ [0.2,2.2] | 12.3 [6,25]/ [5,46] | 0.0002 [0.0001,0.0004] |
| Zambia | 150 [122,161] | 0.55 [0.2,1.4]/ [0.1,2.3] | 8.7 [4,22]/ [2,36] | 0.0001 [0.0001,0.0003] |
| Uganda | 151 [121,165] | 0.54 [0.2,1.4]/ [0.1,3] | 20 [7,53]/ [5,113] | 0.0003 [0.0001,0.0008] |
| Liberia | 152 [141,170] | 0.53 [0.1,0.7]/ [0.1,1.8] | 2.2 [0,3]/ [0,7] | 0 [0,0] |
| Kenya | 153 [139,164] | 0.48 [0.2,0.7]/ [0.2,1.5] | 21.1 [9,32]/ [7,65] | 0.0003 [0.0001,0.0005] |
| Mali | 154 [145,158] | 0.45 [0.4,0.6]/ [0.2,1.4] | 8.3 [7,10]/ [4,25] | 0.0001 [0.0001,0.0002] |
| Oman | 155 [147,171] | 0.42 [0.1,0.5]/ [0.1,1.3] | 1.9 [0,2]/ [0,6] | 0 [0,0] |
| Afghanistan | 156 [144,167] | 0.4 [0.1,0.6]/ [0.1,1.4] | 11.2 [4,16]/ [3,38] | 0.0002 [0.0001,0.0002] |
| Iraq | 157 [134,168] | 0.4 [0.1,0.9]/ [0.1,1.5] | 14.6 [4,34]/ [3,57] | 0.0002 [0.0001,0.0005] |
| Nigeria | 158 [142,163] | 0.39 [0.2,0.6]/ [0.2,1.6] | 67.7 [38,112]/ [27,272] | 0.0011 [0.0006,0.0018] |
| Sierra Leone | 159 [148,172] | 0.37 [0.1,0.5]/ [0,1.2] | 2.6 [0,3]/ [0,8] | 0 [0,0.0001] |
| Eritrea | 160 [150,172] | 0.36 [0.1,0.4]/ [0.1,1.2] | 1.9 [0,2]/ [0,6] | 0 [0,0] |
| Turkmenistan | 161 [154,173] | 0.29 [0.1,0.4]/ [0.1,0.9] | 1.4 [0,2]/ [0,4] | 0 [0,0] |
| Chad | 162 [122,173] | 0.28 [0,1.2]/ [0,2.6] | 4.1 [1,18]/ [1,38] | 0.0001 [0,0.0003] |
| Burkina Faso | 163 [149,171] | 0.26 [0.1,0.5]/ [0.1,0.8] | 5 [2,10]/ [2,15] | 0.0001 [0,0.0002] |
| Yemen | 164 [155,173] | 0.23 [0,0.3]/ [0,0.8] | 6.3 [1,9]/ [1,22] | 0.0001 [0,0.0001] |
| Sudan | 165 [157,171] | 0.22 [0.1,0.3]/ [0.1,0.7] | 9 [2,12]/ [2,31] | 0.0001 [0,0.0002] |
| Guinea | 166 [159,173] | 0.2 [0.1,0.3]/ [0,0.7] | 2.6 [1,3]/ [0,9] | 0 [0,0.0001] |
| Myanmar | 167 [158,168] | 0.2 [0.1,0.3]/ [0.1,0.6] | 11 [8,16]/ [5,31] | 0.0002 [0.0001,0.0002] |
| India | 168 [159,170] | 0.17 [0.1,0.3]/ [0.1,0.6] | 219 [134,348]/ [79,755] | 0.0035 [0.002,0.0056] |
| Lesotho | 169 [162,173] | 0.16 [0,0.2]/ [0,0.4] | 0.3 [0,0]/ [0,1] | 0 [0,0] |
| Mozambique | 170 [165,173] | 0.13 [0,0.2]/ [0,0.5] | 3.5 [1,5]/ [1,12] | 0.0001 [0,0.0001] |
| Ethiopia | 171 [167,173] | 0.1 [0.1,0.1]/ [0,0.3] | 10.3 [5,14]/ [4,35] | 0.0002 [0.0001,0.0002] |
| Bangladesh | 172 [168,173] | 0.1 [0.1,0.1]/ [0,0.3] | 15.1 [10,19]/ [6,48] | 0.0002 [0.0002,0.0003] |
| Somalia | 173 [169,173] | 0.08 [0,0.1]/ [0,0.2] | 0.9 [0,1]/ [0,3] | 0 [0,0] |
| South Sudan | 174 [173,174] | 0.02 [0,0]/ [0,0.1] | 0.3 [0,0]/ [0,1] | 0 [0,0] |
| Papua New Guinea | 175 [175,175] | 0 [0,0]/ [0,0] | 0 [0,0]/ [0,0] | 0 [0,0] |

Your model says Kyrgyzstan has 16 Esperanto speakers but actually I was the only one for 15 years before I left Kyrgyzstan for Canadian Vancouver 3 months ago. Now it has 0.
LikeLike
thats why i wanna learn esperante i wanna be unique in my country lmao
LikeLike
About Hungary: no, Esperanto is not taught in schools. The answer is even more simple: the Hungarian language education is terrible, so the Hungarians don’t really speak languages. Because of this the Hungarian governments try to raise the number of language speakers at least among the most educated. So in Hungary you need to have a language exam to receive a college/university degree (BA, BSC, MA, MSC). For several years Esperanto and Lovari were extremely popular options as they were accepted. As these languages are easier to learn, it takes less time and money to achieve results. If I remember well Esperanto and Lovari were removed from the accepted languages a few years ago but the ones already taken a language exam are still here.
Thanks for this very professional article!
LikeLike
Thanks! And thank you for the clarification of Esperanto in the hungarian school system. However, I think Esperanto is still taught as an optional subject; according to https://eo.m.wikipedia.org/wiki/Statistiko_de_Esperantujo, 800 people passed the Esperanto exam in 2018.
LikeLike
Dankon pro la detala statistiko. Ŝajnas, ke abundas laboro antaŭ oni plibonigi la rangon de miaj samlandanoj.
LikeLike
how can there be a decimal point in number of total esperanto speakers?
LikeLiked by 1 person
There can’t be a decimal point in the actual number of esperanto speakers but there can be a decimal point in an *estimate* of the number of esperanto speakers and the decimal numbers in this post are estimates. I could have signalled that 62983.9 is an estimate by writing “approximately 60000” instead of “62983.9”. I didn’t, because I also wanted to emphasize that the the estimate was the result of a computation and not a guess.
LikeLike
[…] I also looked into which country has the most number of Esperanto speakers per inhabitant and this website has a very good write-up on […]
LikeLike